Investors
We maintain a transparent, comprehensive dialogue with the financial community about our strategy, outlook, financial data, economic environment, and social impact.
Second Quarter 2026 Results
Second quarter 2026 results will be reviewed by management during a live audio webcast with the financial community on July 30, 2026. The presentation will be followed by a Q&A session.
Press Releases
Upcoming Events
30Jul
Second quarter 2026 results
Second quarter 2026 results will be reviewed by management during a live audio webcast with the financial community on July 30, 2026. The presentation will be followed by a Q&A session.
13:00 - 14:15 CET (7:00am - 8:15am EDT)
Quarterly results
9Sep
Kepler Cheuvreux Autumn Conference l Paris
Speaker : Thomas Grenier, Head of North America, Vaccines
Conferences
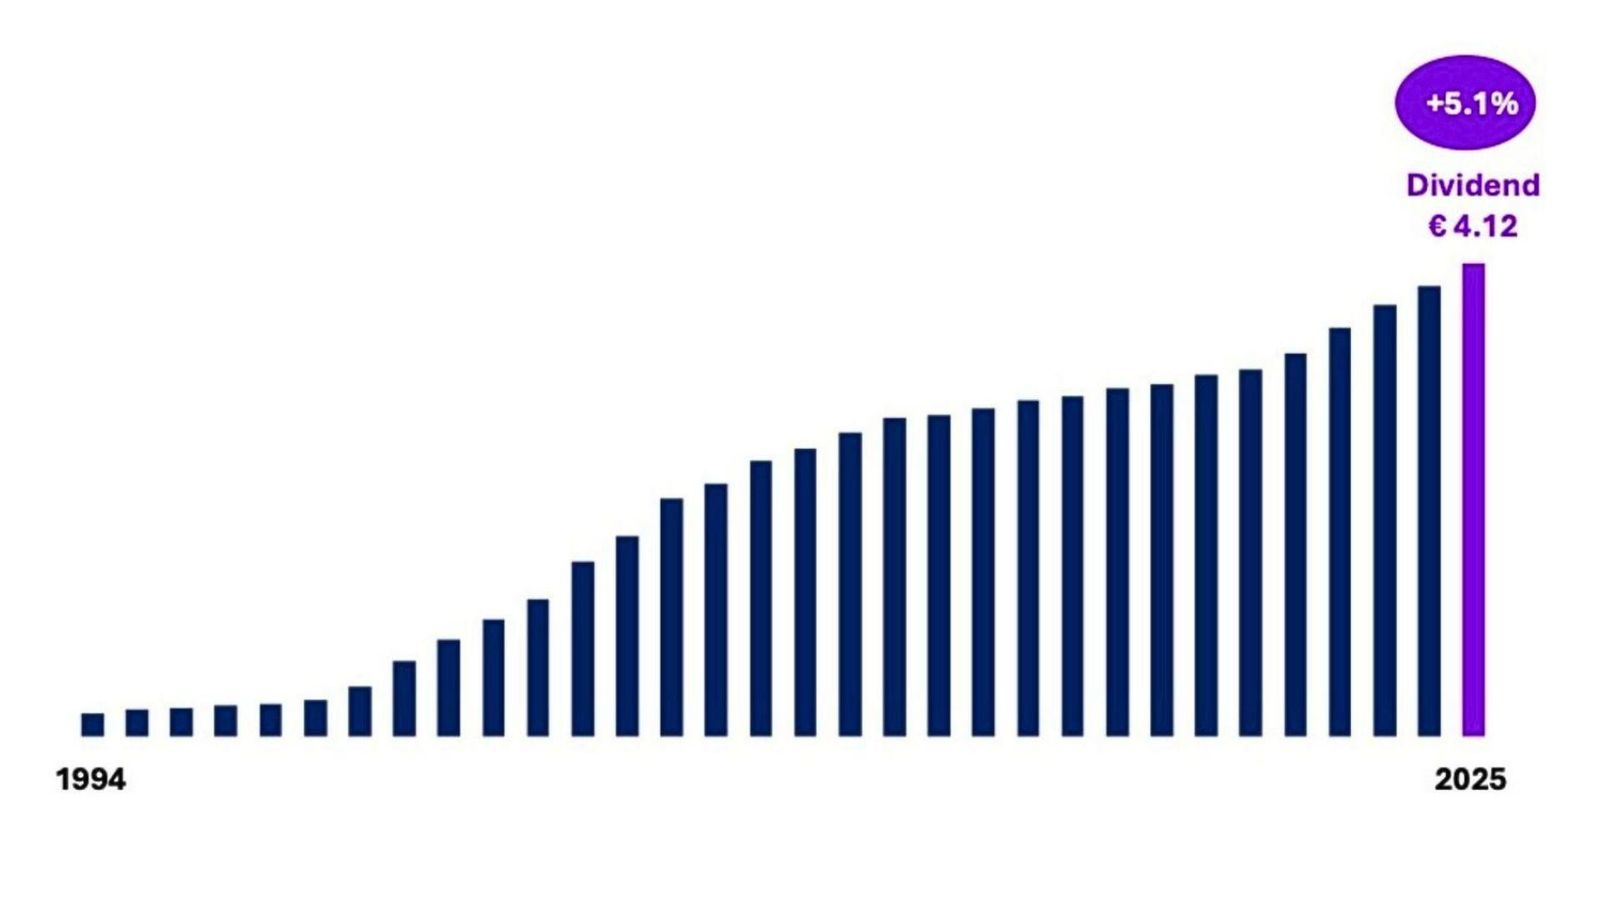
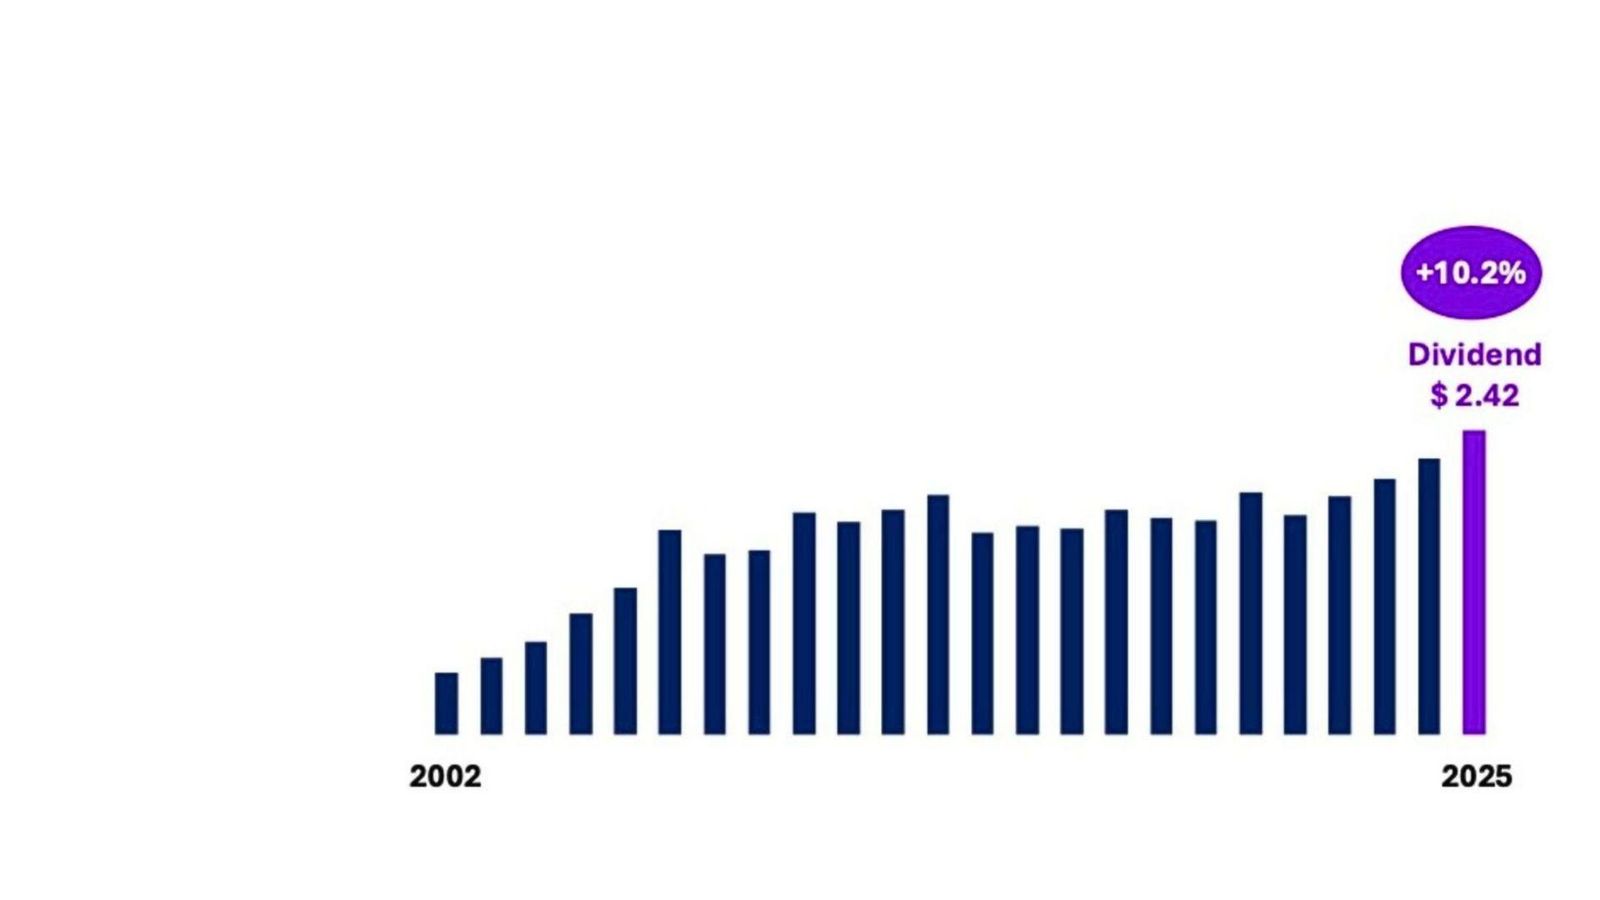
Dividend (in dollars) per ADR (½ share)

Environment, Social, Governance
As a global pharmaceutical company, we stretch everyday to deliver safe and sustainable innovation and play our part in addressing some of the world’s most pressing challenges.
Contact Our Investor Relations Team
For general inquiries
Please contact the switchboard, +33 (0)1 53 77 40 00